
Contribution Margin vs Gross Margin: What Differs
Gross margin subtracts the cost of goods sold from revenue. Contribution margin subtracts every variable cost from revenue, including variable selling and admin costs that never touch the cost of goods sold line. Gross margin tells you how profitable your core product is after production. Contribution margin tells you how much each sale adds toward fixed costs and profit. The two numbers can be close or far apart, and which one you should watch depends on the decision in front of you.
RaremindFind the costs behind your marginsRaremind’s Money Map helps identify lost revenue, excessive costs and process inefficiencies, with independent advice tailored to your business.Explore Raremind’s approach
TL;DR
Gross margin = (revenue − cost of goods sold) ÷ revenue. It is the number most outsiders, lenders and investors expect to see.
Contribution margin = (revenue − all variable costs) ÷ revenue. It ignores fixed costs and includes variable costs outside COGS, such as sales commissions and payment fees.
Use gross margin to judge competitiveness and pricing against your market. Use contribution margin for break-even, product mix and “should we keep selling this?” decisions.
The two can match, but often don’t, because COGS can contain fixed factory costs and variable costs can sit below the COGS line.
Table of Contents
The core difference in one table
What gross margin measures
What contribution margin measures
One business, both margins
When each margin is the right tool
Going further: CM1, CM2 and CM3
Where variable margin fits
Reading a 30% margin
Mistakes that distort both numbers
Our perspective: margins are a map, not a verdict
Get a second pair of eyes on your margins
How to run the numbers this week
Sources
The core difference in one table
Gross margin | Contribution margin | |
|---|---|---|
Formula | Revenue − COGS | Revenue − total variable costs |
Costs subtracted | Costs of producing or buying what you sold | Costs that rise and fall with volume |
Fixed production overhead | Usually included in COGS | Excluded |
Variable selling costs (commissions, shipping, card fees) | Usually below the line, not included | Included |
Best question it answers | How profitable is the core product? | How much does each extra sale add toward fixed costs? |
Typical audience | Investors, lenders, outside readers | Owners and managers |
The cleanest way to remember it: gross margin sorts costs by function (did it go into making the product?), while contribution margin sorts costs by behavior (does it change when volume changes?).
What gross margin measures
Gross margin is the difference between sales revenue and the cost of goods sold. As a percentage, it is (total revenue − COGS) ÷ total revenue. A pottery maker selling $6,000 of goods with $2,000 of COGS has a 66% gross margin, using the same source’s example.
What counts as COGS depends on your business. For a manufacturer it usually includes materials, direct labor and a share of factory overhead. For a retailer it is mostly what you paid for the goods. For a service business it might be the delivery labor tied to client work.
Gross margin is a measure of competitiveness, as the Horngren cost-volume-profit chapter puts it. It lets you compare your production economics against peers and against your own past periods, and it can flag the need to change production costs or pricing.
What contribution margin measures
Contribution margin is the selling price less the variable cost per unit, and what remains contributes toward fixed costs such as rent and manager salaries. Divide it by the selling price and you get the contribution margin ratio: the share of each sales dollar left after unit variable costs.
Which costs are variable? Course material from Penn State lists direct materials, direct labor, variable manufacturing overhead, and variable selling and administrative expenses such as commissions. Fixed costs such as rent and machinery are left out because they do not change with production volume.
A simple per-unit example: a pen sells for $2.00 and carries $0.60 in variable costs, so the contribution margin is $1.40 per pen, a 70% ratio. Every pen sold puts $1.40 toward fixed costs, and once those are covered, toward profit.
One business, both margins
The clearest way to see the gap is to run both calculations on the same hypothetical numbers. Take a small candle maker with $100,000 in annual sales.
Line item | Amount | Behavior |
|---|---|---|
Wax, jars, wicks | $25,000 | Variable, in COGS |
Production labor paid per batch | $12,000 | Variable, in COGS |
Workshop rent and equipment depreciation | $8,000 | Fixed, in COGS |
Marketplace commissions | $6,000 | Variable, below COGS |
Shipping | $5,000 | Variable, below COGS |
Card processing fees | $3,000 | Variable, below COGS |
Salaries, software, insurance, other overhead | $20,000 | Fixed, below COGS |
Gross margin
COGS = $25,000 + $12,000 + $8,000 = $45,000
Gross profit = $100,000 − $45,000 = $55,000
Gross margin = 55%
Contribution margin
Variable costs = $25,000 + $12,000 + $6,000 + $5,000 + $3,000 = $51,000
Contribution margin = $100,000 − $51,000 = $49,000
Contribution margin ratio = 49%
Two things moved the numbers in opposite directions. The $8,000 of workshop rent is in COGS but is fixed, so it hurts gross margin and not contribution margin. The $14,000 of commissions, shipping and fees sits below COGS but is variable, so it hurts contribution margin and not gross margin. LibreTexts explains the mechanism: variable costing treats fixed factory overhead as a period cost rather than putting it in inventory or COGS, so the two figures differ because costs are classified differently.
Neither is wrong. Both reach the same destination: operating income is $21,000 either way ($55,000 gross profit less $34,000 of operating costs, or $49,000 contribution less $28,000 of fixed costs). The contribution-format and financial-statement-format income statements report the same operating income; they just reorder the costs to answer different questions.
When each margin is the right tool
Use gross margin for pricing and outside reporting
Gross margin is the standard line on a financial statement. If a bank, investor or buyer asks about margins, they mean this one. It is also the right first check on pricing: if your gross margin is shrinking while sales hold steady, your input costs or discounts are the place to look.
It also gives, in the words of one ecommerce guide, an overall sense of core-business profitability, which makes it a good scoreboard for the business as a whole.
Use contribution margin for break-even and product decisions
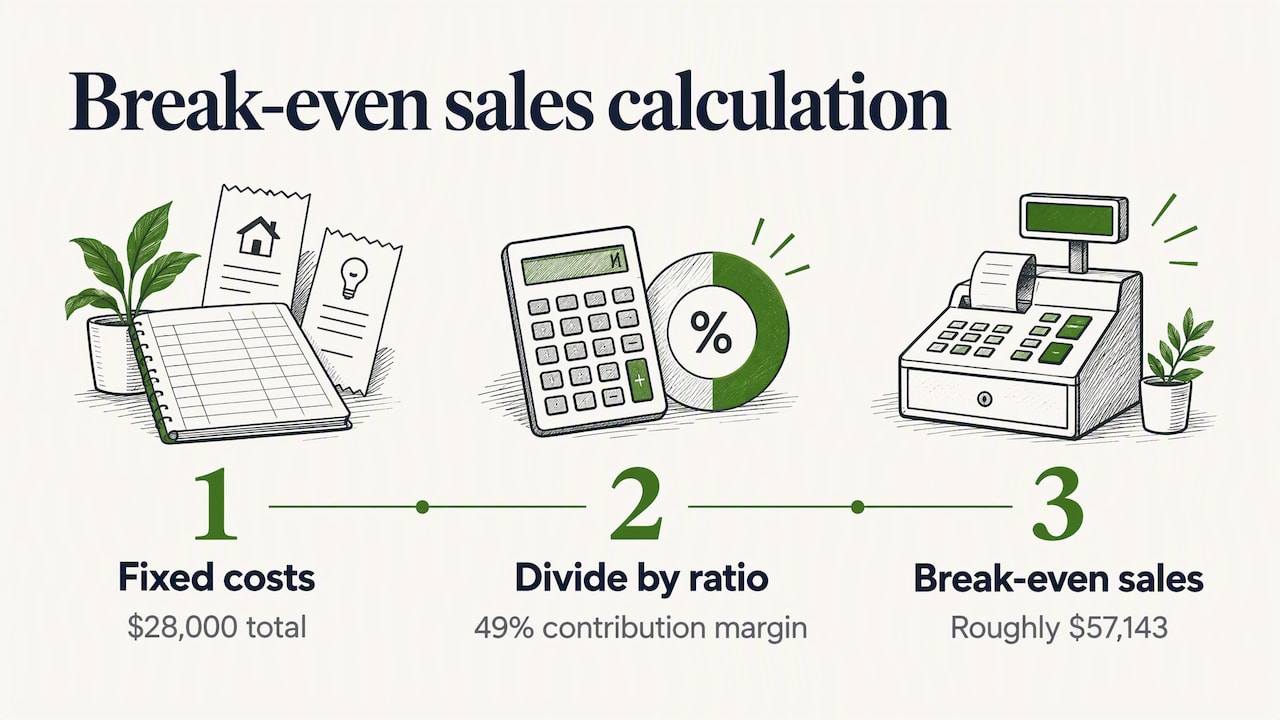
Contribution margin is a foundation for break-even analysis. In the candle example, fixed costs are $8,000 + $20,000 = $28,000. Dividing by the 49% ratio gives a break-even of roughly $57,143 in sales. You can’t get that number from gross margin, because gross margin mixes a fixed cost (rent) into the cost base and leaves out variable costs below the line.
It also helps when products compete for the same resources. Management can choose among products competing for the same manufacturing resources and put capacity behind the ones with higher profit potential. A product with a decent gross margin but heavy shipping and commission costs can have a thin contribution margin, and that only shows once you look at it.
When the contribution margin is low or negative, the options are the usual three: discontinue the product, raise its price, or lower its variable costs.
Cost behavior matters most where production is intensive. A machine shop estimating a job, for instance, needs to know which costs move with every hour of spindle time and which are there regardless, which is why shops pair variable costing with machining cost estimation when they price work.
The Lumen managerial accounting text makes the same point: variable costing can give decision-makers more accurate information because costs are better tied to production levels.
Going further: CM1, CM2 and CM3
Many growing businesses, especially online sellers, split contribution margin into levels. One finance guide describes CM1 as sales minus cost of goods sold, traditionally called gross profit. CM2 then subtracts directly attributable costs such as logistics and payment fees, and CM3 also subtracts marketing costs.
This is useful because it shows where margin disappears. If CM1 is healthy and CM3 is thin, the product isn’t the problem. Fulfillment or acquisition cost is. Gross margin alone would have hidden that.
Where variable margin fits
You will sometimes see “variable margin” in spreadsheets and management reports. In most companies it is simply another label for contribution margin: revenue minus variable costs. Because the term is informal, confirm with whoever built the report which costs they treated as variable before comparing it with another company’s figure. Some teams use it to mean “revenue minus variable COGS only,” which sits between the two measures.
Reading a 30% margin
A 30% gross margin means that for each dollar of sales, 30 cents is left after the cost of goods sold. A 30% contribution margin means 30 cents is left after all variable costs, to cover fixed costs and then profit. Whether that is good depends on the business. One finance source states there is no universal benchmark: a useful contribution margin has to be read alongside fixed overhead, growth rate and life-cycle stage.
A 30% contribution margin can be fine for a high-volume business with low fixed costs. It can be fatal for a business with heavy fixed costs and slow growth. The practical test is the break-even calculation above: divide fixed costs by the ratio and ask whether that sales level is realistic.
Mistakes that distort both numbers
Treating them as interchangeable. Contribution margin must be labeled distinctly, and the FFI Standard glossary says it must not be presented as a substitute for gross margin in financial statements or investor reporting. It also notes that variable operating expenses can make it lower than gross margin.
Misclassifying semi-variable costs. A utility bill with a base charge plus usage, or a salaried team that gets overtime, needs to be split rather than put wholly in one bucket.
Leaving out variable selling costs. Commissions, shipping and payment fees are easy to overlook, and they are what separates the two measures for most small companies.
Using blended figures to judge single products. A healthy company-wide margin can hide a loss-making product line. Calculate per product or per customer segment.
Comparing across companies without checking definitions. One firm’s COGS includes warehouse rent; another’s doesn’t. Compare your own trend first.
Our perspective: margins are a map, not a verdict
When we look at a company’s operations, we don’t start with software or with a list of tools. We start with how the business makes money, then look for where it leaks. Margins are one of the quickest ways to find those leaks, and the two measures show different ones.
Gross margin tends to reveal problems in what you charge and what you pay suppliers. Contribution margin reveals problems in how you sell and deliver: the discounts, the fulfillment costs, the commissions, the channels that look busy but add little. We see owners who are proud of a strong gross margin while a fifth of their revenue is quietly consumed by variable costs that sit below the line.

That is the reason our Money Map traces each revenue stream to its real variable costs before any recommendation is made. It makes the conversation about automation or tooling much more honest. If a process costs $3 per order and the order contributes $4, the question is not which tool to buy. It is whether that channel, price or workflow should exist in its current form. We don’t sell software or take vendor commissions, so the answer can be a process change, a price change or no new technology at all.
If you track only one margin, you are looking at half the picture. Track both, and let the decision decide which one leads.
— Mirko
Get a second pair of eyes on your margins
If you can calculate these figures but aren’t sure what to do about them, that is the work we do. Your Digital & AI Office is our ongoing advisory plan at €995 per month: we map how your business makes money, find where revenue and cost leak, and advise on process, automation and tool decisions without selling you any software. Larger hands-on initiatives are scoped separately.

If you want to work on costs first, our guide to cost reduction strategies for small businesses shows why we look at operations before technology.
How to run the numbers this week
List every cost line from your last full year of income statements.
Tag each as variable or fixed, based on whether it moves with sales volume. Split mixed costs.
Calculate gross margin using your reported COGS.
Calculate contribution margin using only variable costs, wherever they sit on the statement.
Repeat per product or service line. The gaps between lines are usually more useful than the totals.
Compute break-even: fixed costs divided by the contribution margin ratio.
Compare the two margins. A large gap means you have either heavy fixed costs in COGS or heavy variable costs below it. Both are worth understanding.
If your accountant uses a different cost classification, ask for the reasoning rather than overriding it. The goal is a consistent method you can compare month to month.
FAQ
Is contribution margin the same as gross margin?
No. Gross margin subtracts only the cost of goods sold, which may include fixed production overhead. Contribution margin subtracts all variable costs, including variable selling and administrative costs, and leaves fixed costs out. The figures coincide only when COGS happens to equal total variable costs.
Which is higher, contribution margin or gross margin?
It depends on your cost structure. If COGS carries a lot of fixed overhead, contribution margin tends to be higher. If you have large variable selling costs such as commissions and shipping, contribution margin tends to be lower. In our candle example it came out at 49% against a 55% gross margin.
Is 30% a good contribution margin?
There is no universal threshold. It has to be judged against your fixed costs, growth stage and break-even volume. Divide fixed costs by 0.30 to see the revenue you need to break even, then ask whether that is realistic for your business.
When should a small business use contribution margin?
Use it whenever you are deciding about volume: pricing a product, setting a sales target, choosing which products to promote, or deciding whether to drop one. Keep gross margin for external reporting and for comparing your production economics with peers.
Sources
Contribution Margin Explained: Definition and Calculation (Investopedia)
Gross Margin vs. Contribution Margin: Key Profitability Differences (Investopedia)
3.1 Explain Contribution Margin and Calculate Contribution Margin (OpenStax)