
Capability Mapping: How to Build a Map That Drives Decisions
Capability mapping is the practice of listing what your business must be able to do, such as win customers, deliver, bill and collect, and then rating how well it does each one. The result is a one-page picture of where you are strong, where you leak money, and where an investment of time or software would pay off. This guide shows you how to build that map for a small or mid-sized company, what a good one looks like, and how to score maturity without turning it into a six-month project.
RaremindFind the Gaps Behind Lost RevenueRaremind’s Money Map helps identify lost revenue, excessive costs, and process inefficiencies, with independent advice that avoids unnecessary technology.Explore Raremind
TL;DR
A capability map describes what a business does, not how or who does it. That is why it stays stable while tools and org charts change.
Build it around one named decision, such as where to cut cost or which tool to buy, and go only as deep as that decision requires.
A capability map shows the whole business at once. A process map shows the steps inside one capability. You need both, in that order.
Score each capability on a simple 1 to 5 maturity scale against a target, then fix the red cells that touch revenue first.
Treat the map as a living document. A one-time assessment goes stale quickly.
Table of Contents
What capability mapping actually is
What a capability map looks like
How to build a capability map in seven steps
Capability map vs. process map
Process maturity: scoring each capability
Common mistakes
Our perspective
From map to action
How we can help
Sources
What capability mapping actually is
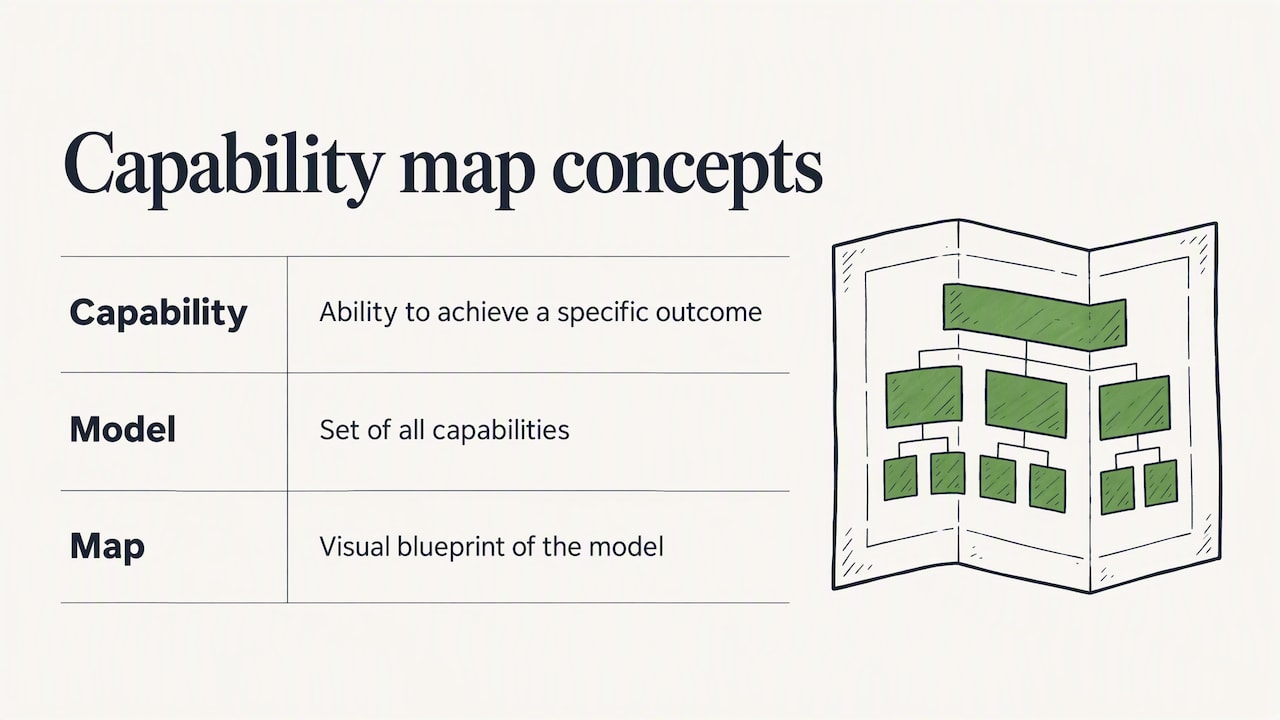
A business capability is a particular ability or capacity a business may have to achieve a specific purpose or outcome. It says what the business does, and leaves out where, why or how it is done, according to the EKG Maturity framework. “Manage customer billing” is a capability. “Send invoices from QuickBooks on the 1st” is not: it names a tool, a timing and a method.
The set of all your capabilities is the capability model. The capability map is its visual form, the blueprint, as Architecture & Governance Magazine puts it. In a map, each capability appears once, arranged in a hierarchy, so everyone looks at the same picture of the company.
That sounds like enterprise architecture jargon, and in large corporations it often is. But the idea scales down well. A 25-person distributor has capabilities too: quote, order, fulfill, invoice, collect, support, hire, forecast. Few owners have ever written them on one page and asked which ones are weak.
Why a capability view beats an org chart
An org chart shows who reports to whom. A tool list shows what you pay for. Neither tells you whether the business can reliably do the things that earn money. Forrester describes capability maps as showing capabilities at several levels of abstraction with their parent-child relationships, so that leaders can manage operations, prioritize investments and find areas to improve. Once the map exists, each argument about where to spend money has a shared reference.
What a capability map looks like
Most maps are a grid. Broad domains sit across the top, and each domain holds boxes for its capabilities, with sub-capabilities beneath when needed. Salesforce’s architecture library shows a business capability map template that places business drivers, such as revenue growth, operational cost reduction and customer retention, next to the capabilities that serve them. That link between a driver and a capability is the useful part.
A worked example at larger scale: a published energy utility capability map shows 28 capabilities across 7 areas, each with a current maturity from 1 to 5 against a target, plus annual IT spend per capability. Notice what that does. It puts money and maturity on the same page, so you can see a capability that costs a lot and performs badly.

A small-business example
Here is how a 30-person B2B services firm might sketch its top level. The names are illustrative, not from a real client.
Domain | Capabilities | Current maturity (1 to 5) | Target |
|---|---|---|---|
Win business | Generate leads, Qualify leads, Prepare proposals, Close deals | 2, 2, 3, 3 | 4 |
Deliver | Schedule work, Deliver service, Manage quality, Handle change requests | 3, 4, 2, 1 | 4 |
Get paid | Invoice accurately, Collect overdue payments, Reconcile accounts | 3, 1, 2 | 4 |
Keep customers | Onboard clients, Support clients, Renew contracts | 3, 2, 1 | 4 |
Run the company | Hire and onboard staff, Forecast cash, Manage vendors and tools | 2, 2, 1 | 3 |
Read it like a doctor reads a chart. “Collect overdue payments” at 1, “Handle change requests” at 1, and “Renew contracts” at 1 are three places where revenue quietly walks out the door. None of these needs a new platform to be discussed. They need someone to look at how the work actually flows.
How to build a capability map in seven steps
The formal method varies by source, but the sequence is consistent. The IIBA’s guide to capability analysis outlines it as: define scope, collect data, engage stakeholders, identify and map capabilities, assess interdependencies and gaps, prioritize improvements, build a roadmap, and reassess (IIBA business capability analysis). Here is that sequence in a form a business owner can run.
1. Name the decision first
Before you draw anything, write one sentence: “This map must help us decide ___.” Examples: whether to replace the CRM, where to trim costs by 10%, which team to hire next, or whether the business is ready for AI. A map without a decision becomes a wall poster. If your decision is about AI, our guide to AI readiness and mapping revenue workflows before buying tools shows the same logic from the tool side.
2. Set the scope
Pick the whole company or one business unit. For companies under 100 people, the whole company is usually right, because the handoffs between sales, delivery and finance are where the leaks are.
3. List capabilities as noun phrases
Write each as an ability: “Invoice customers,” “Forecast demand,” “Onboard new hires.” Keep out department names (“Finance”), systems (“Salesforce”) and people (“Sarah’s quoting”). If a box would disappear when you switch software, it is not a capability. APQC makes the same point: a capability covers more than a process, and can include delivery models, structures, systems, tools, knowledge, rules, roles, training and skills (APQC on process maps and capability maps).
4. Group them into domains
Start with how money moves: win, deliver, get paid, keep. Add a support group for people, finance, technology and vendors. Five to eight domains is plenty.
5. Go only as deep as the decision needs
Common models use two to four levels. For most small businesses, two is enough: domain and capability. Add a third level only where a capability is clearly weak and you need to see why. The IIBA warns against stopping at a high-level view alone and recommends exploring valuable capabilities further so you can see what enables them operationally or technologically. The balance: shallow everywhere, deep only where the decision lives.
6. Rate maturity and set a target
Use a 1 to 5 scale. The next section explains it. Rate with the people who do the work, not just the owner. Managers often rate a capability higher than the person running it each day.
7. Attach money
For each capability, add three numbers where you can: annual cost (people, tools, vendors), revenue it touches, and an estimate of what a failure costs. This is the step most capability maps skip, and it is the step that turns a diagram into a priority list.
Capability map vs. process map
People confuse these constantly. The difference is altitude.
Capability map | Process map | |
|---|---|---|
Question answered | What must we be able to do? | How exactly is it done? |
Shows | The combination of processes, people, information, knowledge and tools needed for an objective | Steps, tasks, responsibilities, inputs, outputs and handoffs |
Scope | Whole business on one page | One workflow at a time |
Stability | Changes slowly | Changes whenever the work changes |
Best use | Choosing where to invest or fix | Fixing or automating a specific flow |
This comparison follows APQC’s explanation, which links strategy to capabilities and capabilities to the process maps that guide execution.
In practice: use the capability map to find that “Collect overdue payments” is your weakest revenue capability. Then draw the process map for just that capability, from invoice sent to cash received, and look for the delays, the missing reminders and the manual re-keying. Doing it in the other order is how companies end up polishing a process that never mattered.
Process maturity: scoring each capability
A maturity model gives you a common scale. The best-known one, the Capability Maturity Model, was designed to assess software development processes, and maturity models generally exist to identify strengths and weaknesses and guide actions toward higher maturity levels. You do not need the formal model. A plain scale does the job:
Level | Name | What it looks like in a small business |
|---|---|---|
1 | Ad hoc | Depends on one person’s memory. Results vary week to week. |
2 | Repeatable | Usually done the same way, but nothing is written down. |
3 | Defined | Documented, with an owner, and people follow it. |
4 | Measured | You track time, error rate or cost and act on the numbers. |
5 | Optimized | Regularly improved, with routine steps automated. |
Level 5 is not the goal everywhere. A capability that is not tied to revenue or risk can stay at 2 forever. Set targets by importance: customer-facing and cash-related capabilities deserve a 4, back-office housekeeping may be fine at 3.
Reading the heat map
Color the gap between current and target. The Open Group’s TOGAF guidance notes that a stoplight metaphor, red, yellow and green, is typically used in maturity heat maps to show the distance between current and target maturity. Red cells are not automatically your first job. Rank them by two questions: how much money does this capability touch, and how cheaply can the gap be closed? A red cell in a capability that touches half your revenue and can be fixed by a rule change beats a red cell that needs a new system.
Do not assess once and file it
Static assessments age fast. Researchers have proposed the Continuous Maturity Assessment Method, a five-phase loop: preparing the maturity model, specifying the assessment, tracking and assessing capabilities, reporting with an action plan, and maintaining or retiring the assessment (Stoiber et al., 2023). For a small business, translate that into a habit: re-rate the red and yellow cells every quarter, and the whole map once a year.
The tracking habit matters most when you change systems. When a new platform goes in, a clear onboarding and implementation plan gives you milestones to check against the capability scores you recorded beforehand, so you can tell whether maturity actually moved.
Common mistakes
Mapping the org chart. If your boxes match your departments, you drew an org chart with different labels.
Mapping tools. “HubSpot” is a product. “Manage customer relationships” is the capability it supports.
Going too deep too early. A 300-box map nobody reads is worse than a 30-box map everyone uses. Ardoq notes that a map can look simple while the relationships beneath it are complex to keep accurate (Ardoq guide), so keep your first version small enough to maintain by hand.
Rating by opinion alone. Back every score with one fact: an error count, days to collect, hours per week of rework.
Skipping the money column. Without cost and revenue attached, every red cell looks equally urgent.
Letting vendors draw the map. A map drawn by someone who sells software tends to find software-shaped gaps.
Our perspective
We start every engagement with the question most technology consultants skip: how does this business actually make money? Our Money Map is a capability map with the revenue and cost attached. It is a standard method applied to each client’s own situation, so the recommendations are specific to them.
In our experience the most valuable output is rarely a new tool. It is the discovery that two or three capabilities, often quoting, collections or renewals, are carrying more risk than anyone realized, and that a change in how the work is handled will fix them. Sometimes the right answer is automation. Sometimes it is dropping three overlapping subscriptions. Sometimes it is doing nothing yet.
Because we sell no software and take no vendor commissions, we can say “you do not need that” and mean it. A capability map is only as honest as the person holding the pen, and that is the reason independence matters here more than in most advisory work.
— Mirko
From map to action
Once you have scores and money attached, the work sorts itself into three piles.
Fix the practice. Weak capabilities caused by missing ownership, unclear rules or inconsistent habits. These are the cheapest wins and need no technology.
Remove cost. Capabilities supported by several overlapping tools or vendors. Consolidating them is a direct saving, and our list of cost reduction strategies that start with operations walks through where to look.
Automate or invest. Capabilities that are well-defined, high-volume and still manual. This is where automation earns its place, and where knowing when AI helps and when it does not saves you from expensive experiments.
Put the first pile ahead of the third. A broken process that gets automated simply produces its errors faster.
How we can help
If you would rather not build this alone, this is the work we do. Your Digital & AI Office is our ongoing advisory plan at €995 per month: we map how your business earns and spends, score the capabilities that matter, and help you act on the findings, with no software sales behind the advice. Larger, hands-on initiatives are scoped as separate projects. You can see how both work on the Raremind site. If you are still deciding what kind of help fits, our comparison of strategic advisory and traditional consulting explains the difference.
FAQ
What is the difference between a business capability model and a capability map?
The model is the complete, stable set of capabilities your organization has, including their definitions and relationships. The map is the visual depiction of that model. In day-to-day business use, people treat the two terms as nearly interchangeable, and that is fine as long as the definitions behind the boxes are written down.
Can you give an example of a business capability?
“Manage claims” for an insurer, “Invoice customers” for a services firm, and “Onboard new hires” for almost any employer are all capabilities. Each describes an ability in a noun phrase without naming a tool, team or method. Insurance examples often arrange these from broad domains down to sub-capabilities such as Manage Claims and Underwrite Policies.
How detailed should a capability map be?
Only as detailed as the decision it supports. Two levels, domain and capability, are enough for most companies under 100 people, and models in the wild commonly run two to four levels. Add depth only to capabilities that score badly or carry a lot of money, and stop there.
How often should I reassess process maturity?
Re-rate weak and high-value capabilities every quarter, and review the whole map yearly or after a major change such as a new system, acquisition or pricing change. Research on maturity assessment argues for continuous tracking rather than one-time snapshots, because a static score stops reflecting reality as the business changes.
Do I need software to do capability mapping?
No. A spreadsheet or a whiteboard is enough for a first version. Software becomes useful only when the map grows large or many people must update it, and by then you will know what you need it to do.
Sources
How to Create a Grounded Capability Model, Architecture & Governance Magazine
Business Analysis Technique: Business Capability Analysis, IIBA
How Should Business-Process Maps Link To Enabling Systems and Technology Architecture, APQC
Keeping Your Maturity Assessment Alive, Business & Information Systems Engineering